MSME Finance Gap

MSME Finance Gap

Tabs 

MSME Finance Gap

An Updated Estimation and Evolution of the MSME Finance Gap in Emerging Markets and Developing Economies

September 2024

Section A: Overview


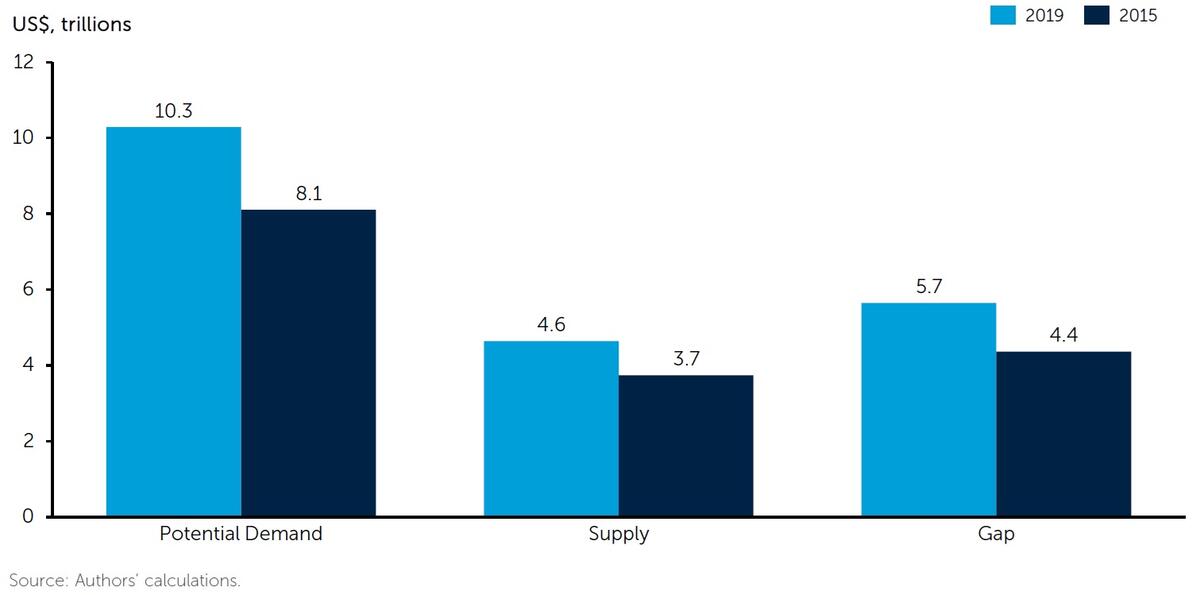
Chart 1: Evolution of the MSME Finance Gap
 
Over a 4 year period (2015 to 2019) the overall MSME finance gap has increased by over US$1.1 trillion, that is, from US$4.4 trillion to US$5.7 trillion, a 27 percent growth. Although the supply of financing has increased by US$991 billion, demand has still outpaced supply, with total demand for credit increasing by US$2.2 trillion. (see figure below). Indeed, the overall gap increased by 27 percent from 2015 to 2019, more than double the growth in GDP, which averaged 13 percent during the same period. The gap as a percentage share of GDP has increased by 2 percentage points, that is, from 17 percent in 2015 to 19 percent in 2019. This suggests that an improvement in closing the relative gap (as a percentage of GDP) has not been achieved through this time period.


Chart 2: Evolution of the W-MSME Finance Gap

Women-owned businesses account for 34 percent of the MSME finance gap. The total MSME finance gap for women42 is estimated to be valued at US$1.9 trillion, which is over 7 percent of total GDP (figure below).
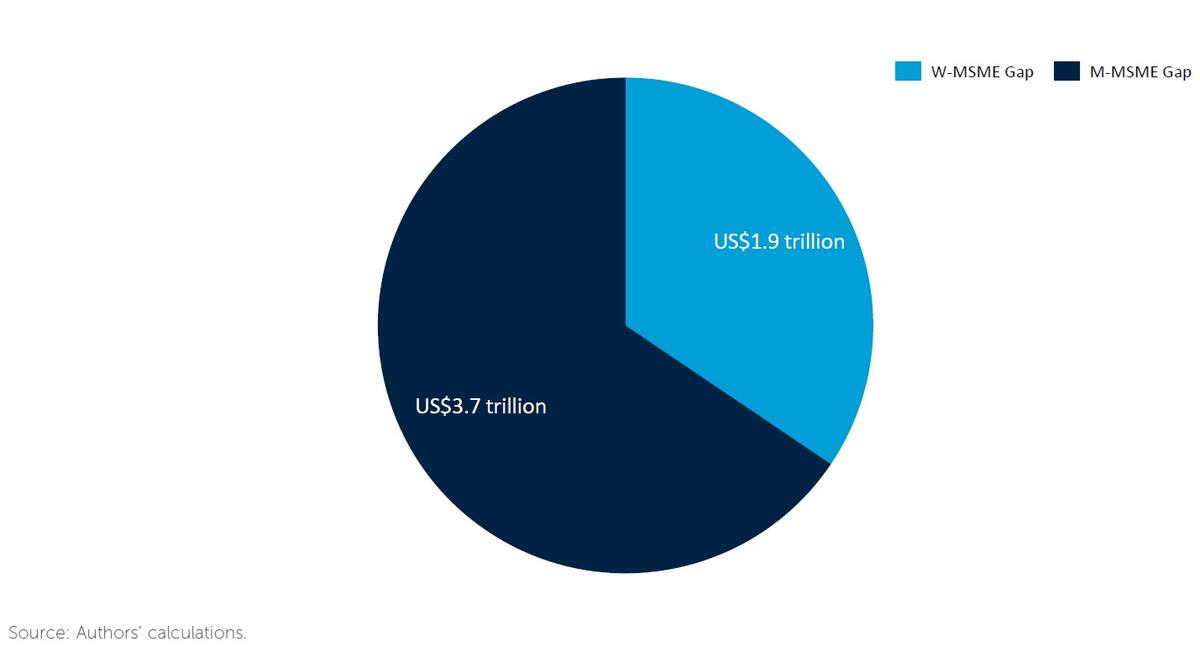
 

Chart 3: Evolution of the MSME Finance Gap by Region

Regional and income group variations of the MSME finance gap are a result of potential demand and supply variations, as discussed in earlier sections.
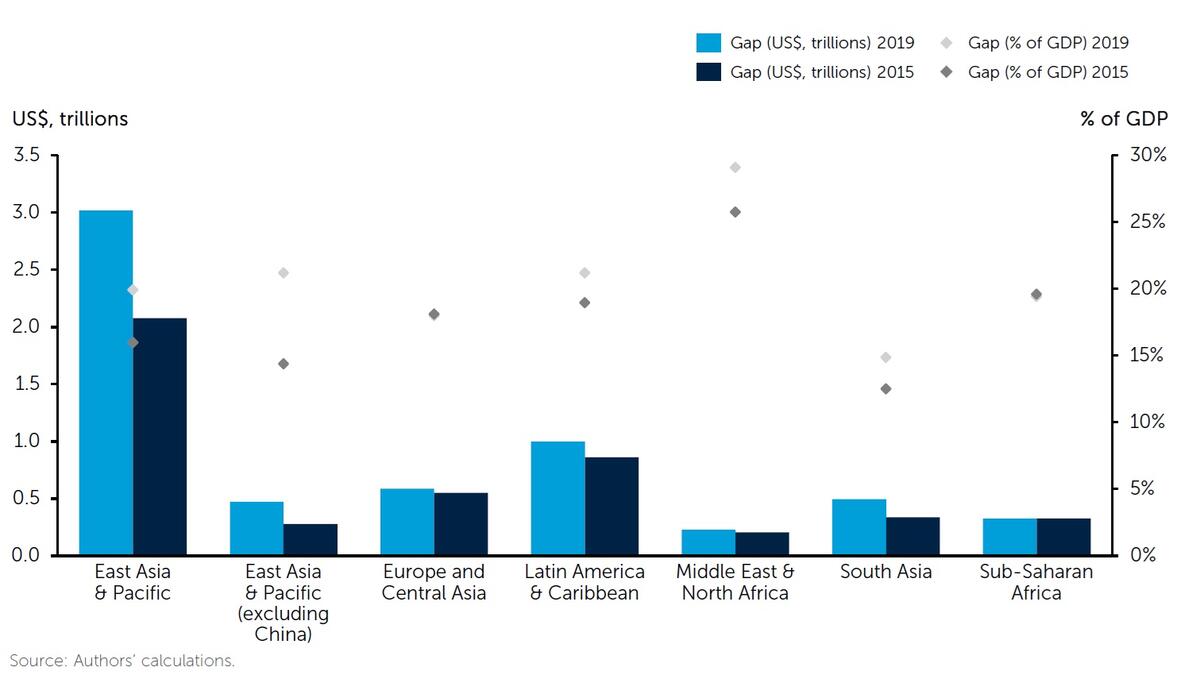
 

Chart 4: Growth in Supply of MSME Finance
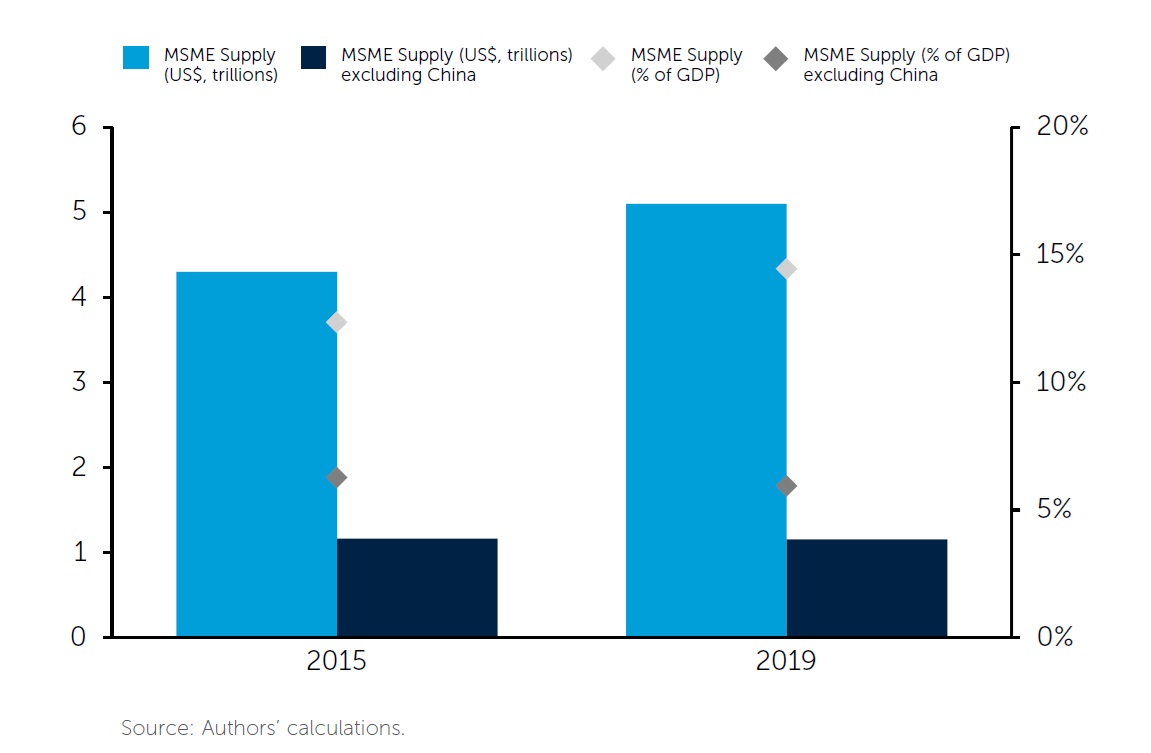
 

In 2019, the supply of MSME credit in EMDEs showed meaningful growth compared to the 2015 estimate. In the four-year period from 2015 to 2019, the supply of financing grew by an average annual rate of 7 percent (see figure below).37
 
37. All analyses presenting the growth from 2015 to 2019 in this section only consider the 119 common countries covered by both the previous and current reports. Thus, the 2015 numbers here may differ from the aggregate number presented in the previous report due to changes in country coverage.
 
 
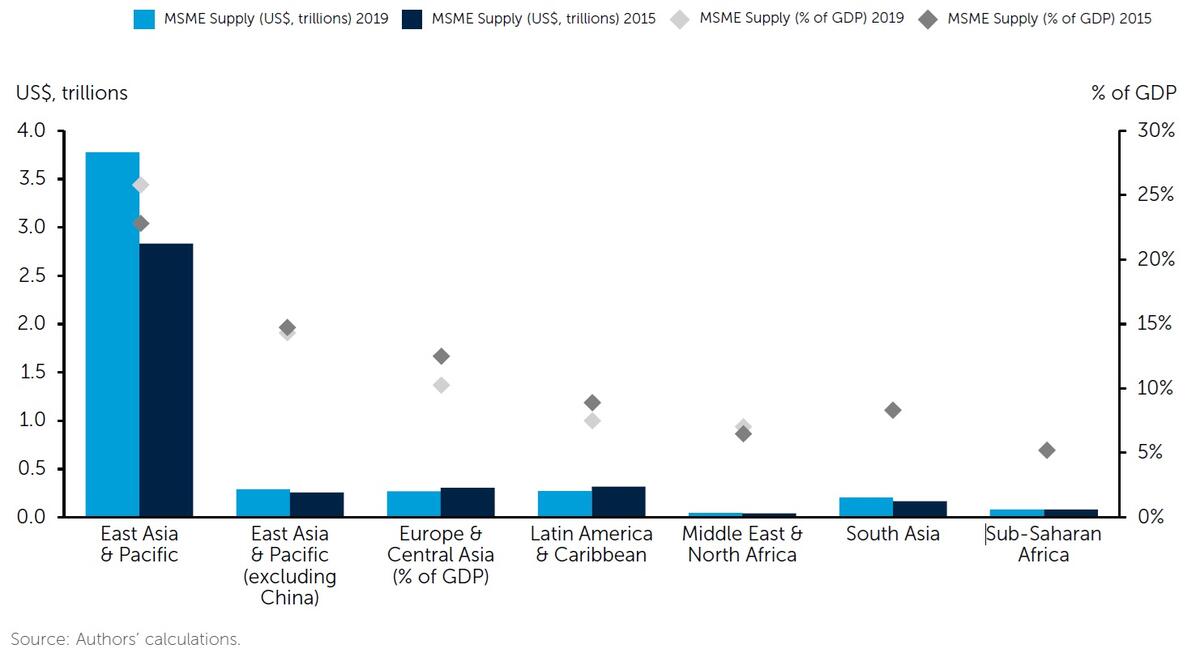
Chart 5: Evolution of the MSME Finance Supply by Region
 
In terms of the supply of MSME credit to GDP ratio, the LAC region saw no growth. For example, there was a contraction in Brazil of almost 3 percentage points, thus negating any growth seen by some of the smaller economies in the region. In the case of Brazil, the steep decline in formal MSME credit supply has followed the trend of slow economic growth with limited growth in domestic credit to the private sector as a percentage of GDP, thus growing by only 0.6 percentage points from 2015 to 2019.39
 
This decline can also be attributed to a variety of reasons, such as private banks favoring larger companies in terms of lending, the outsized role of state-owned banks in providing credit, and the overall high interest rate environment that has persisted in the country, thereby putting downward pressure on the demand and consequently supply of credit.
 
Comparing the growth of supply from 2015 to 2019, more heterogeneity emerges beyond regional groupings to reflect broader macroeconomic trends (figure below). Three ECA countries comprise 75 percent of the bottom four in terms of the decreasing magnitude of supply, namely, Azerbaijan, Kazakhstan, and Tajikistan. Apart from being neighboring countries, all three have seen their 2019 GDP decline relative to 2015. This is potentially due to the decline in oil prices between 2014 and 2016, revenues on which Azerbaijan and Kazakhstan are heavily reliant. Angola, the country which experienced the most precipitous decline in MSME financing volume, also relies heavily on revenues from oil exports. In terms of growth, Guinea-Bissau, Nepal, Cambodia, and Chad top the list, with all seeing MSME volume increasing by more than 50 percent. For these four, their impressive growth in the four-year time span may be due to their previously low levels of MSME financing. As of 2019, all four still register MSME volume to GDP of less than five percent, that is, lower than the full 119 country average of 7 percent.


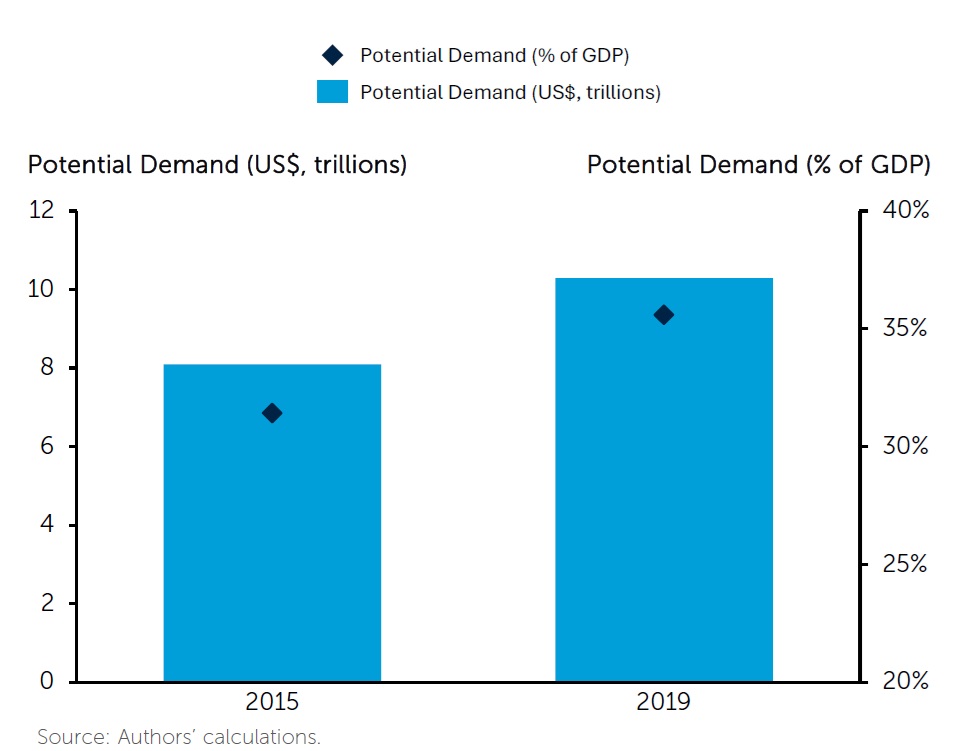
Chart 6: Growth of Potential Demand of MSME Finance
 
Comparing the potential demand in 2019 with that of 2015, the report finds robust growth of 27 percent over the four-year period, that is, from US$8.1 trillion to US$10.3 trillion. Over the same period, the GDP in these economies grew by an average rate of 12 percent. As a result, the potential demand, expressed as a percentage of GDP, also grew from 31 percent to 36 percent (figure below). Even after considering the case of China, potential demand grew at an even higher rate of 42 percent over the 2015-2019 period, representing an average annual increase of more than 10 percent. The change in GDP over the same period was 9 percent for the EMDEs (excluding China).


Chart 7: Evolution of the Potential Demand for MSME Finance Gap by Region


From a regional perspective, the growth in demand of MSME financing presents an interesting picture. In most regions, the demand has grown relatively modestly (figure below). However, in terms of volume, the demand for financing increased annually by approximately 10 percent in both East Asia and the Pacific as well as South Asia over the 4-year period. This stands in contrast to the annual average increase in GDP during the same time period, which was 4 percent and 7 percent, respectively. As a result, when expressed as a share of GDP, the potential demand for financing increased by only 3 percentage points in South Asia and 7 percentage points in East Asia and the Pacific. However, it shows a decline of 2 percentage points for ECA. Overall, there is an increase in demand in terms of volume across all regions, with the exception of ECA (figure below).
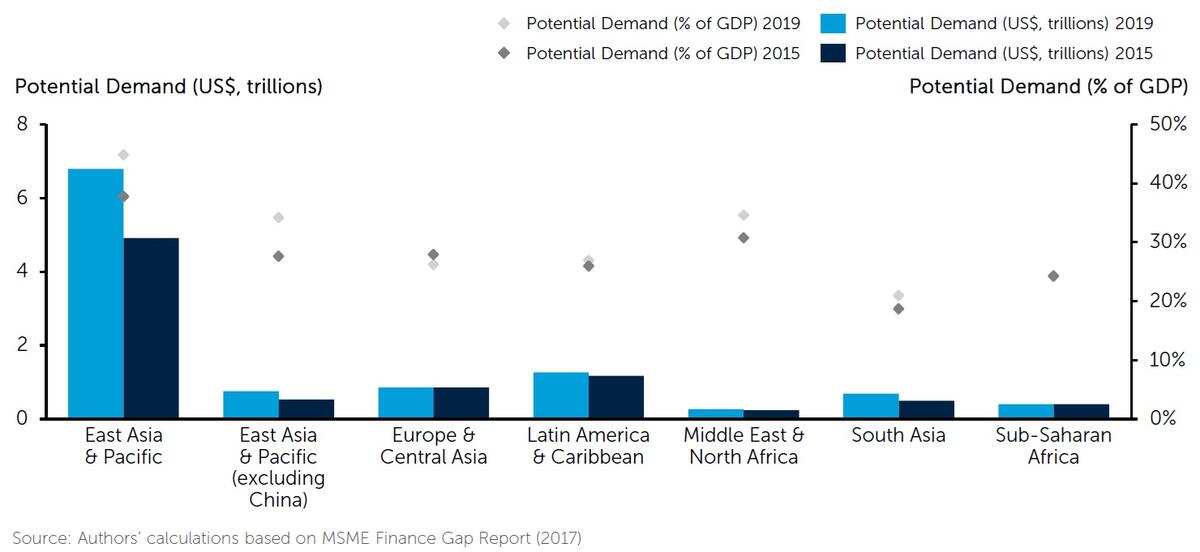


Chart 8: MSME Finance Gap as % of GDP by Country

(Updating in Progress)

Chart 9: Financially Constrained Enterprises as a % of Total Enterprises of the Same Size

(Updating in Progress)

Section B: Country profile


Compare with

Chart 10: Formal MSME Finance Gap | MLN USD

(Updating in Progress)

Chart 11: Formal Finance Gap by Gender | MLN USD

(Updating in Progress)


Section C: Definitions


MICRO enterprises are defined as those with less than 10 employees


SMALL AND MEDIUM ENTERPRISES are defined as those with 11-250 employees


LEVEL OF FINANCIAL CONSTRAINTS

Fully credit-constrained firms are defined as those that find it challenging to obtain credit. These are firms that have no source of external financing. They typically fall into two categories: those that applied for a loan and were rejected; and those that were discouraged from applying either because of unfavorable terms and conditions, or because they did not think the application would be approved. The terms and conditions that discourage firms include complex application procedures, unfavorable interest rates, high collateral requirements, and insufficient loan size and maturity.

Partially credit-constrained firms are defined as those that have been somewhat successful in obtaining external financing. PCC firms include those that have external financing, but were discouraged from applying for a loan from a financial institution. They also include firms that have an external source of financing, and firms that applied for a loan that was then partially approved or rejected.

Non-credit-constrained firms are those that do not appear to have any difficulties accessing credit or do not need credit. Firms in this category encompass those that did not apply for a loan as they have sufficient capital either on their own or from other sources. It also includes firms that applied for loans that were approved in full.


WOMEN-OWNED ENTERPRISES

At least 50 percent female ownership, OR Sole Proprietorships that are female-owned, OR female participation in ownership and management (top manager).

Option 1: At least 50 percent female ownership, OR Sole Proprietorships that are female-owned, OR female participation in ownership and management (top manager).

Option 2: Sole Proprietorships that are female-owned, OR female participation in ownership and management (top manager).


The POTENTIAL DEMAND expresses the amount of financing that MSMEs would need, and financial institutions would be able to supply if they operated in an improved institutional, regulatory and macroeconomic environment.


Section D: Methodology


What does MSME finance gap mean?

MSME finance gap is estimated as the difference between current supply and potential demand which can potentially be addressed by financial institutions. The MSME finance gap assumes that the firms in a developing country have the same willingness and ability to borrow as their counterparts in well- developed credit markets and operate in comparable institutional environments — and that financial institutions lend at similar intensities as their benchmarked counterparts.


How is the MSME finance gap calculated?

The methodology used to calculate the MSME finance gap has three major steps:

Step 1. Benchmarking. At first, the methodology entails benchmarking the prototypical financing environment where MSME credit markets function with minimal imperfections. The mean debt-to- sales ratio is computed across firms operating in the ten benchmarked countries (Australia, Canada, Denmark, Germany, Ireland, Israel, New Zealand, Switzerland, the United Kingdom, and the United States), as presented in the table below:

Step 2. Potential Demand for MSME Finance. These benchmarks are subsequently applied to the universe of MSMEs in each category operating in the emerging economies where the gap is to be calculated. This results in the estimated “potential demand”.

Step 3. Existing Supply of MSME Finance. Existing lending to MSMEs by financial institutions was available for 71 countries mainly from the IMF’s Financial Access Survey (FAS), and the OECD’s SME Scorecard. For the remaining countries, an cross-sectional OLS regression framework was used to predict the missing MSME volume: MSME Lending= α{MSME} + β{Macro} + γ{Banking} + η

MSME Finance Gap

Bringing together the potential demand calculated in step 2 with the current supply collated/computed in step 3 produces the MSME finance gap for each country.
MSME finance gap = Potential demand – Existing supply


What were the data sources used?

MSME data availability and quality in emerging countries remains a significant barrier for researches and practitioners. To address the problem of data quality and scarcity, the authors of this study have expanded and diversified the data sources, which now include Bureau Van Dijk – Orbis data, the International Monetary Fund (IMF) Financial Access Survey data, the Organisation for Economic Co-operation and Development (OECD) Financing SME and Entrepreneurs Scoreboard, and the World Bank Enterprise Survey data, among others. In addition, missing data has been extrapolated using an approach with solid statistical grounds, which is replicable, allowing the database to generate better results as better data comes in. It is also well-documented for those interested in replicating or refining the results.

What are the drawbacks of using these data sources?

The data sources, surveys and studies mentioned above lack cross-country harmonization. Thus, detailed firm-level data with comprehensive information about current financial standing and financing needs are unavailable at the global level. This restriction implies that any estimation of the financing gap has to rely on less complex, firm-level data sources, for example, data collected by the World Bank

Enterprise Surveys. The lack of data also imposes the need to make stronger assumptions than would be necessary if data availability was not an issue.
The lack of uniform data about the informal MSME market segment represents an especially serious constraint. Multiple agencies are working on collecting data from microfinance institutions, including MIX and the Groupe Speciale Mobile Association (GSMA) or mobile network operators, where many informal enterprises might be traced. However, there is no governing body or unified data aggregator which can be confidently used as a source of informality data across all developing countries.


How is the current methodology different from the previous one?

IFC’s previous MSME finance gap study, conducted in 2010 in conjunction with McKinsey, used firm- level datasets to identify enterprises that were credit constrained. It also made assumptions regarding how much these enterprises would want to borrow.

The problems with the previous approach are primarily twofold: (1) the assumptions about how much credit constrained firms would borrow was highly arbitrary; and (2) the counterfactual under which the gap exists was not well defined. The problem stemming from the counterfactual definition was that it was difficult to comprehend the total increase in the demand for finance. The changes in the enabling environment would not only allow an expansion of access to those MSMEs currently without sufficient financing, but would also trigger even more borrowing by those MSMEs that currently had financing. On the supply side, the lack of a definition of the counterfactual also raised uncertainty about the bankability of those currently unserved or underserved MSMEs. In fact, the previous methodology did not consider how much financial institutions would want to finance. Hence, the bankability consideration was entirely absent.

The current methodology defines the counterfactual more concretely. By relying on a benchmarking approach, the regulatory and macroeconomic changes required for the gap to manifest are clearly defined.


Downloads


MSME Finance Gap Report

MSME Finance Gap Database (Updated Oct 2018. Please see the README file for asummary of changes)

MSME Finance Gap README


Contact Us


Sandeep Singh

Sector Economics and Development Impact (IFC)

ssingh13@ifc.org